> ## Documentation Index
> Fetch the complete documentation index at: https://docs.orchestra.bio/llms.txt
> Use this file to discover all available pages before exploring further.
# Program visualizations
For each program, Orchestra creates a multiple out-of-the-box visualizations from the entered data. Editing the data in the program anywhere will update the visualizations everywhere.
Use the tabs at the top of a program to navigate through the different visualizations. Use the **Export** button on the top right to export these visualizations to PNG.
## Summary
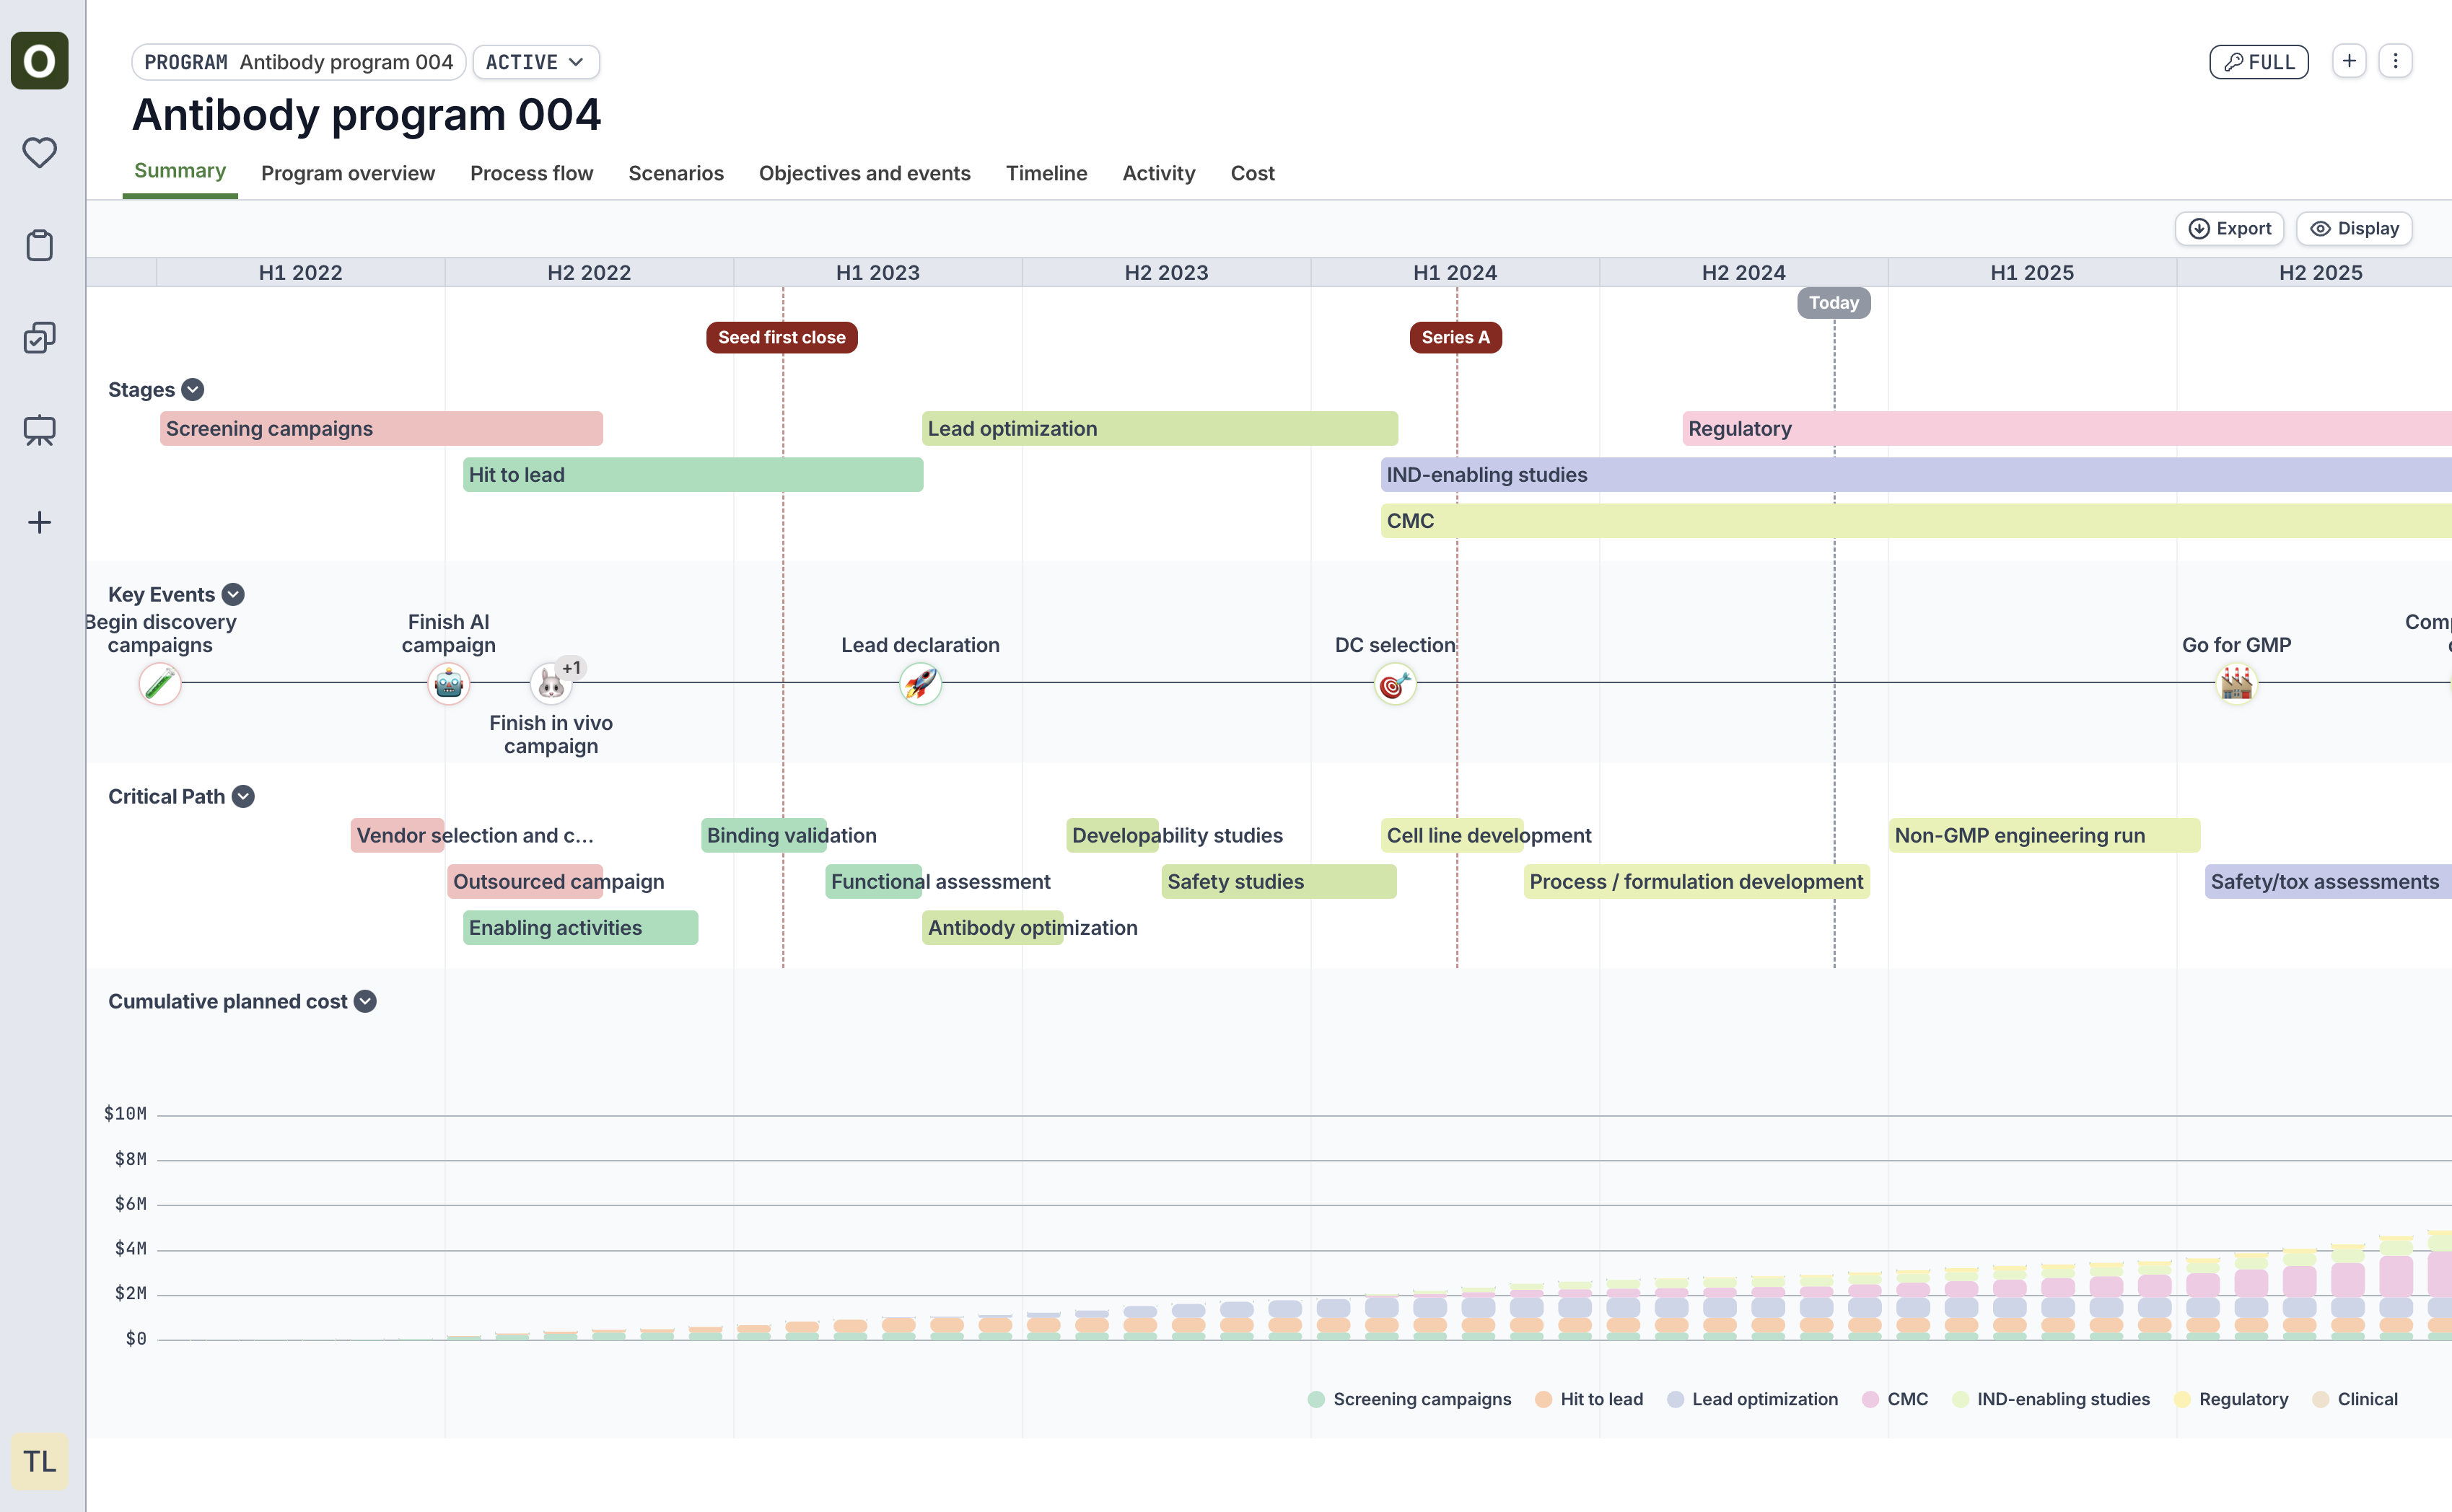
Get an at-a-glance view of the stages, key events, critical path, and cost of the program. Use the **Display** button at the top right to adjust the time intervals and choose what fields to show/hide.
 ## Process flow
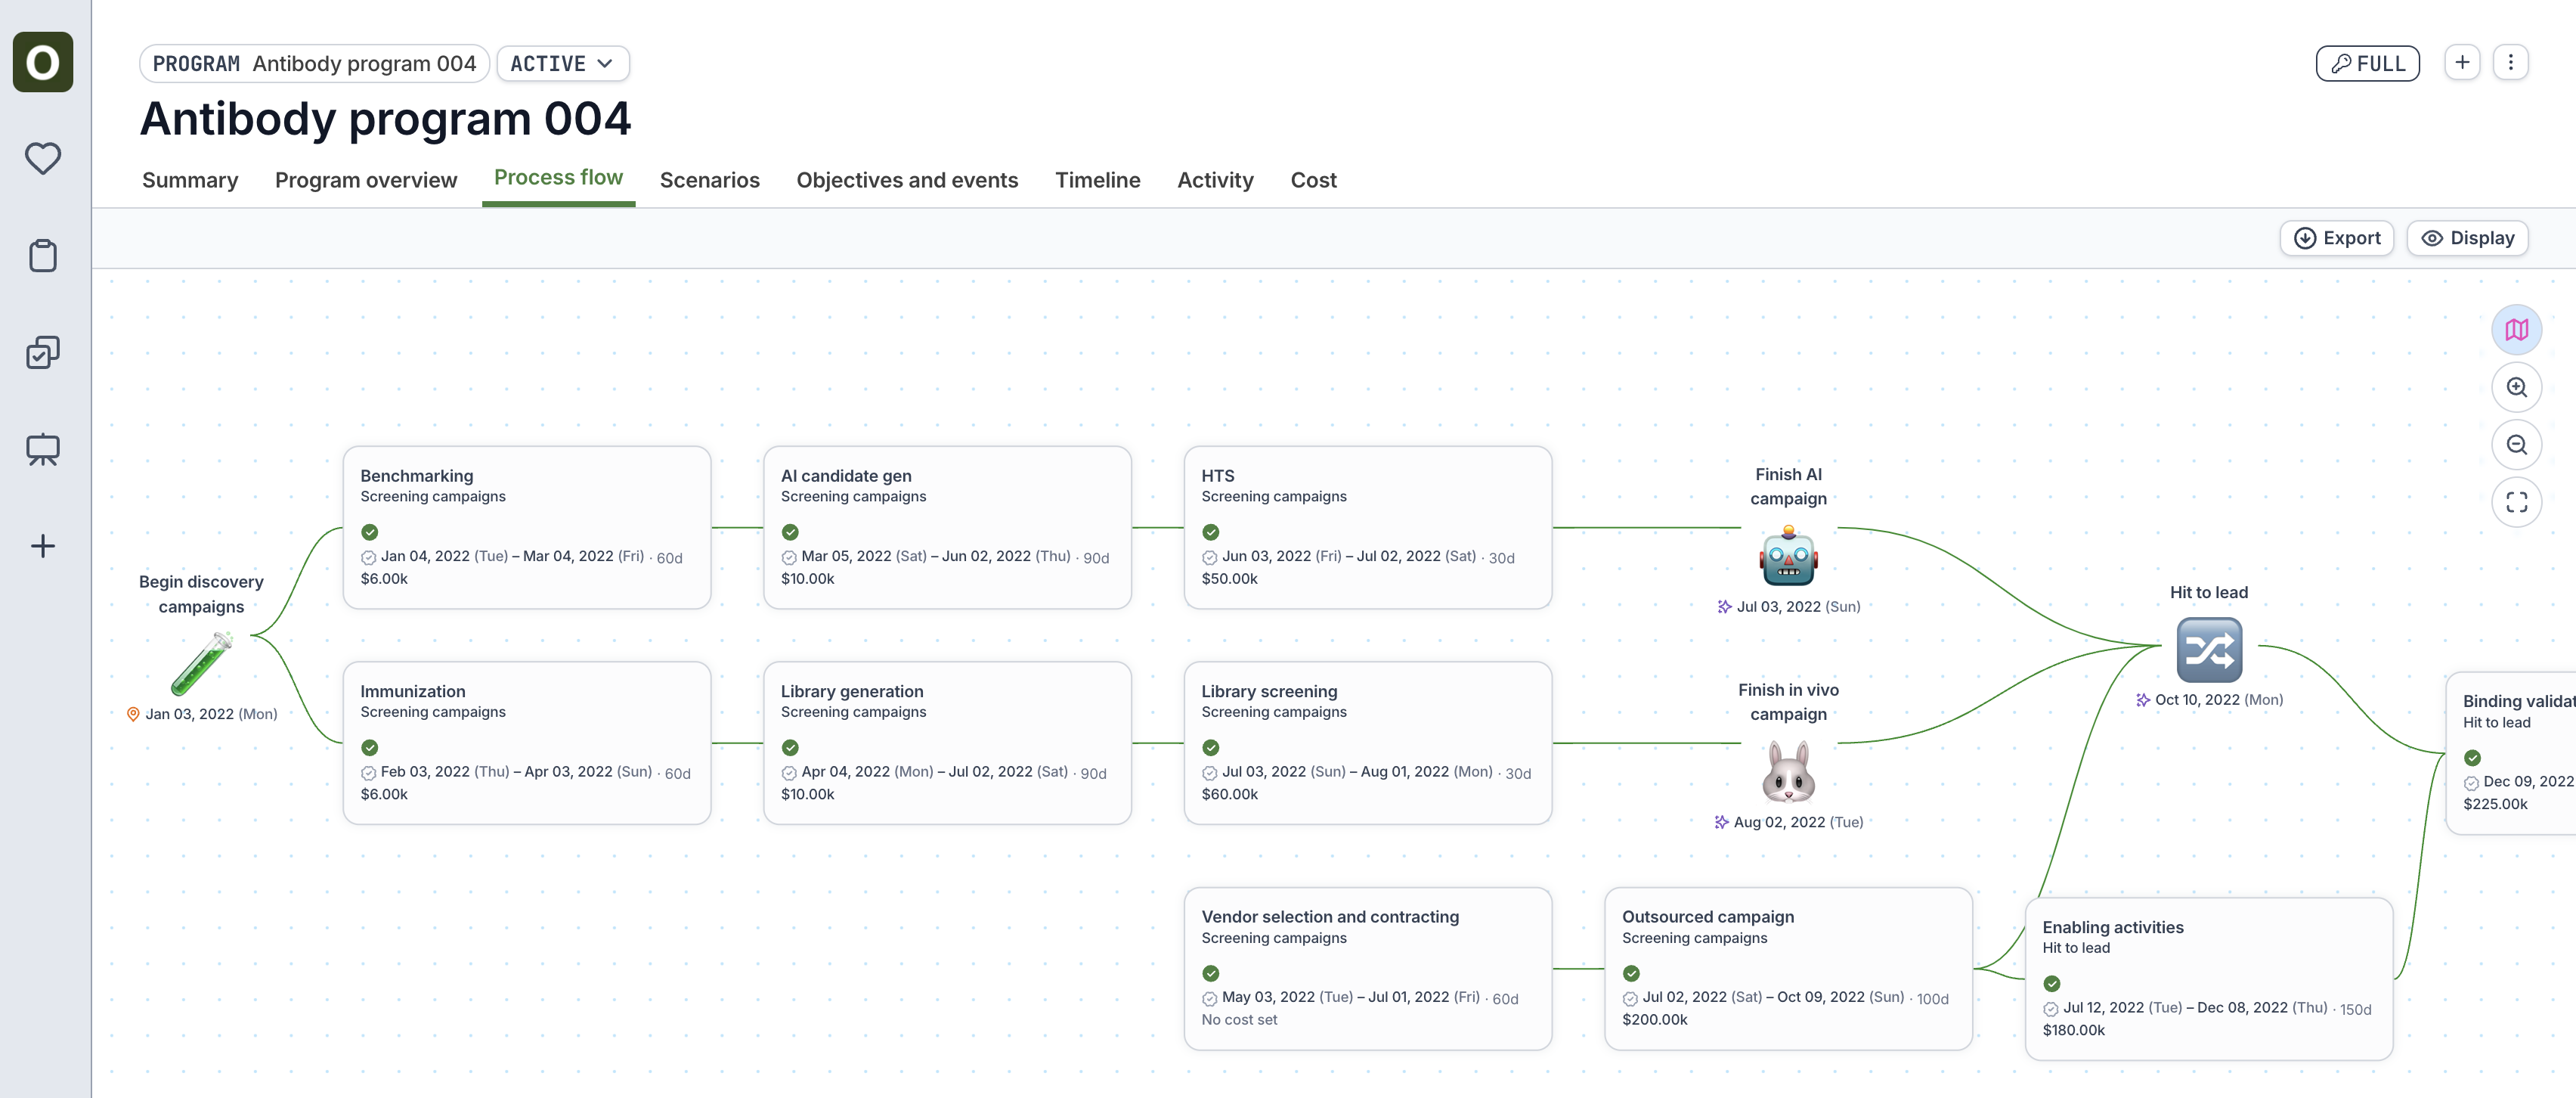
View a map of the dependencies within the program. Use the **Display** button to show/hide fields and to show/hide **Critical Path** (i.e., path of longest duration)
## Process flow
View a map of the dependencies within the program. Use the **Display** button to show/hide fields and to show/hide **Critical Path** (i.e., path of longest duration)
 ## Scenarios
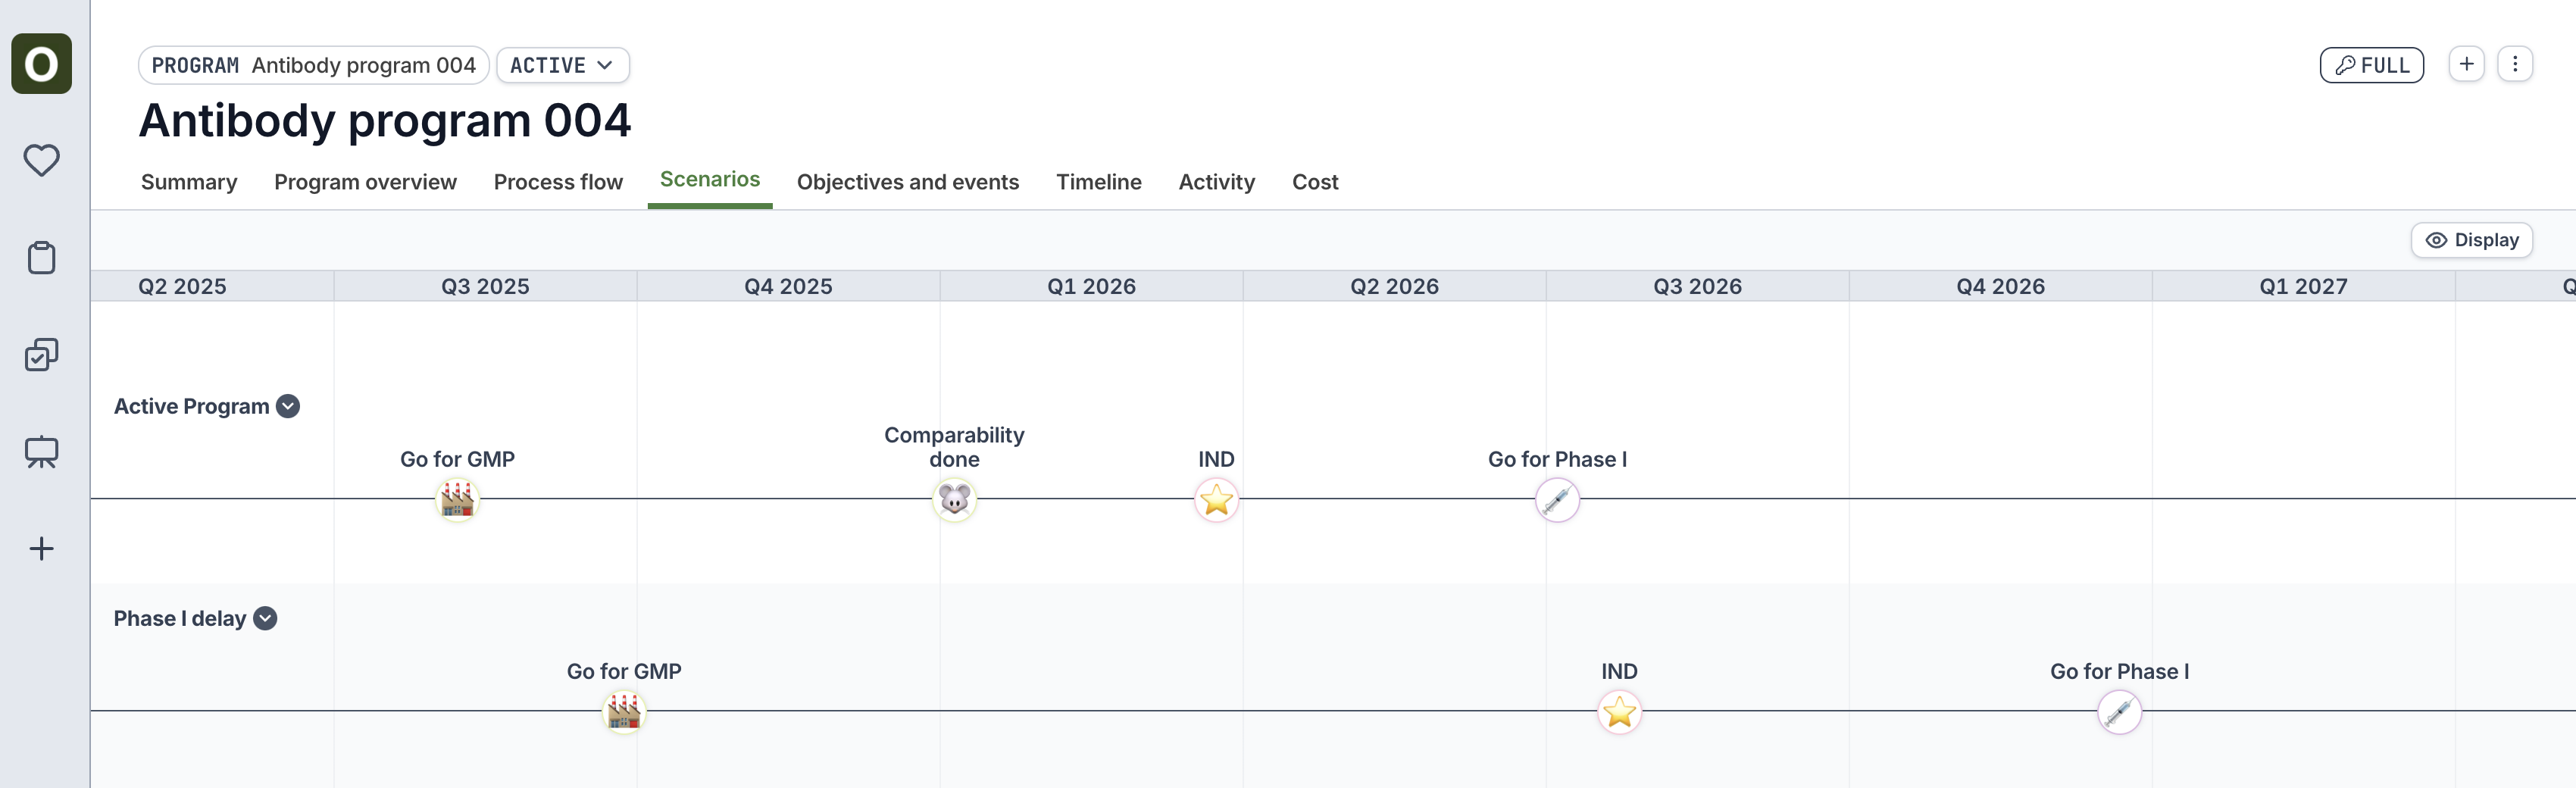
If scenarios have been added to the program (see [Scenarios](/programs/scenario-planning)), view the side-by-side comparison of when the stages and key events will fall in the scenarios vs. active.
## Scenarios
If scenarios have been added to the program (see [Scenarios](/programs/scenario-planning)), view the side-by-side comparison of when the stages and key events will fall in the scenarios vs. active.
 ## Timeline
View a Gantt-like chart of the objectives and key events within the program.
Use the **Display** button on the top right to customize the view:
* **Group by**: Group the swimlanes of the timeline either by stage or by tag
* **Interval**: Adjust the timescale of the timeline
* **Density**: View the timeline bars as condensed vs. stacked
## Timeline
View a Gantt-like chart of the objectives and key events within the program.
Use the **Display** button on the top right to customize the view:
* **Group by**: Group the swimlanes of the timeline either by stage or by tag
* **Interval**: Adjust the timescale of the timeline
* **Density**: View the timeline bars as condensed vs. stacked
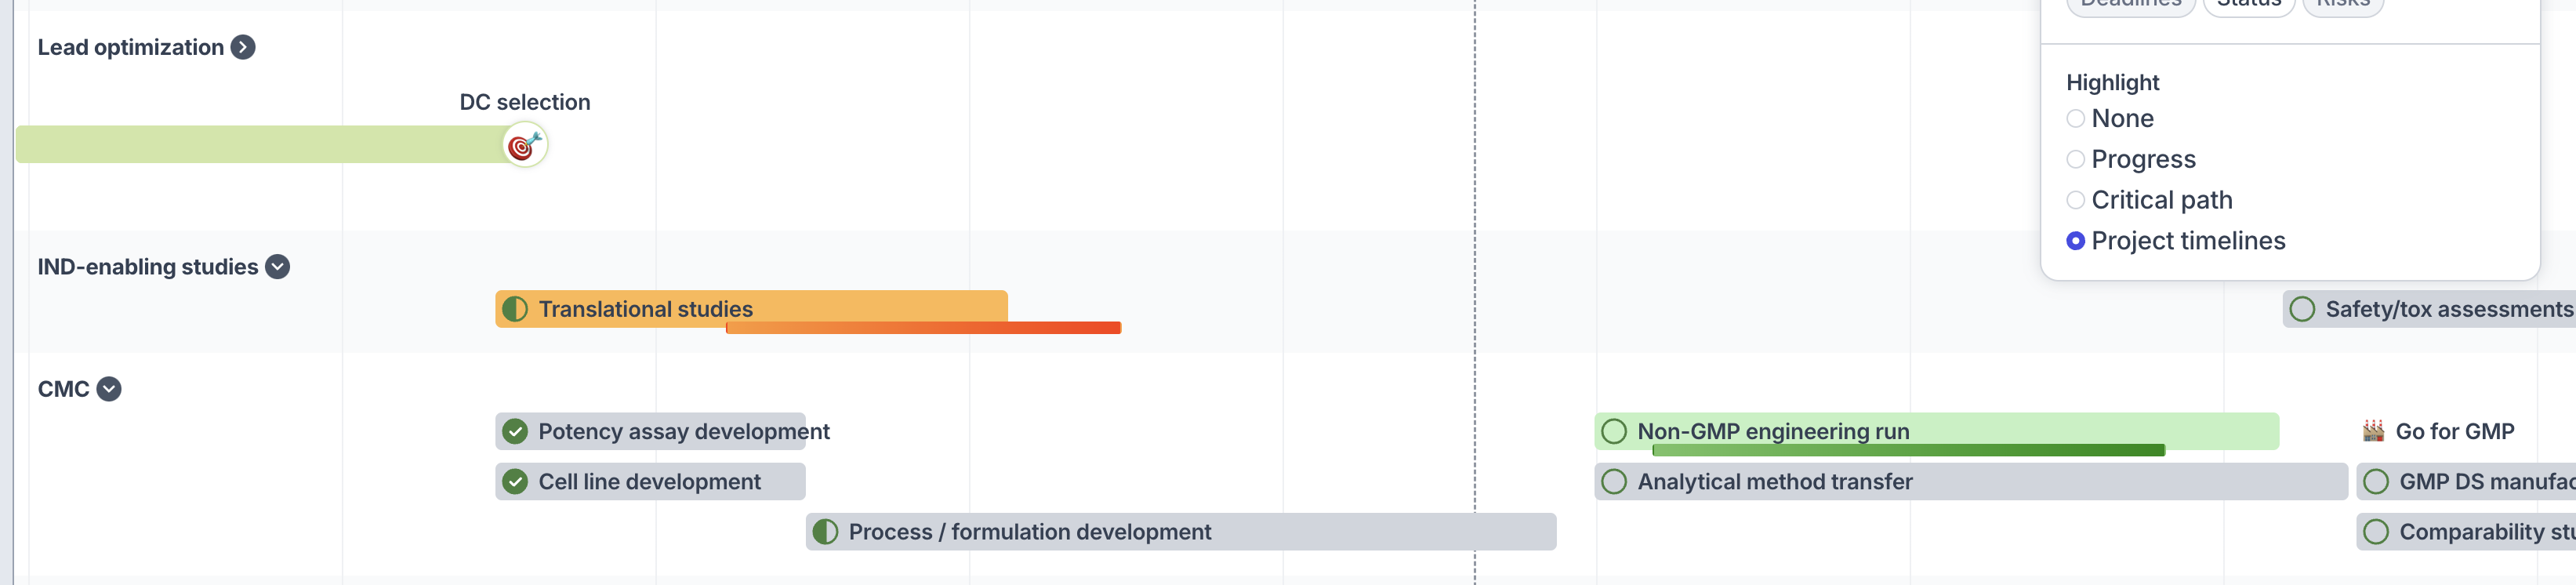
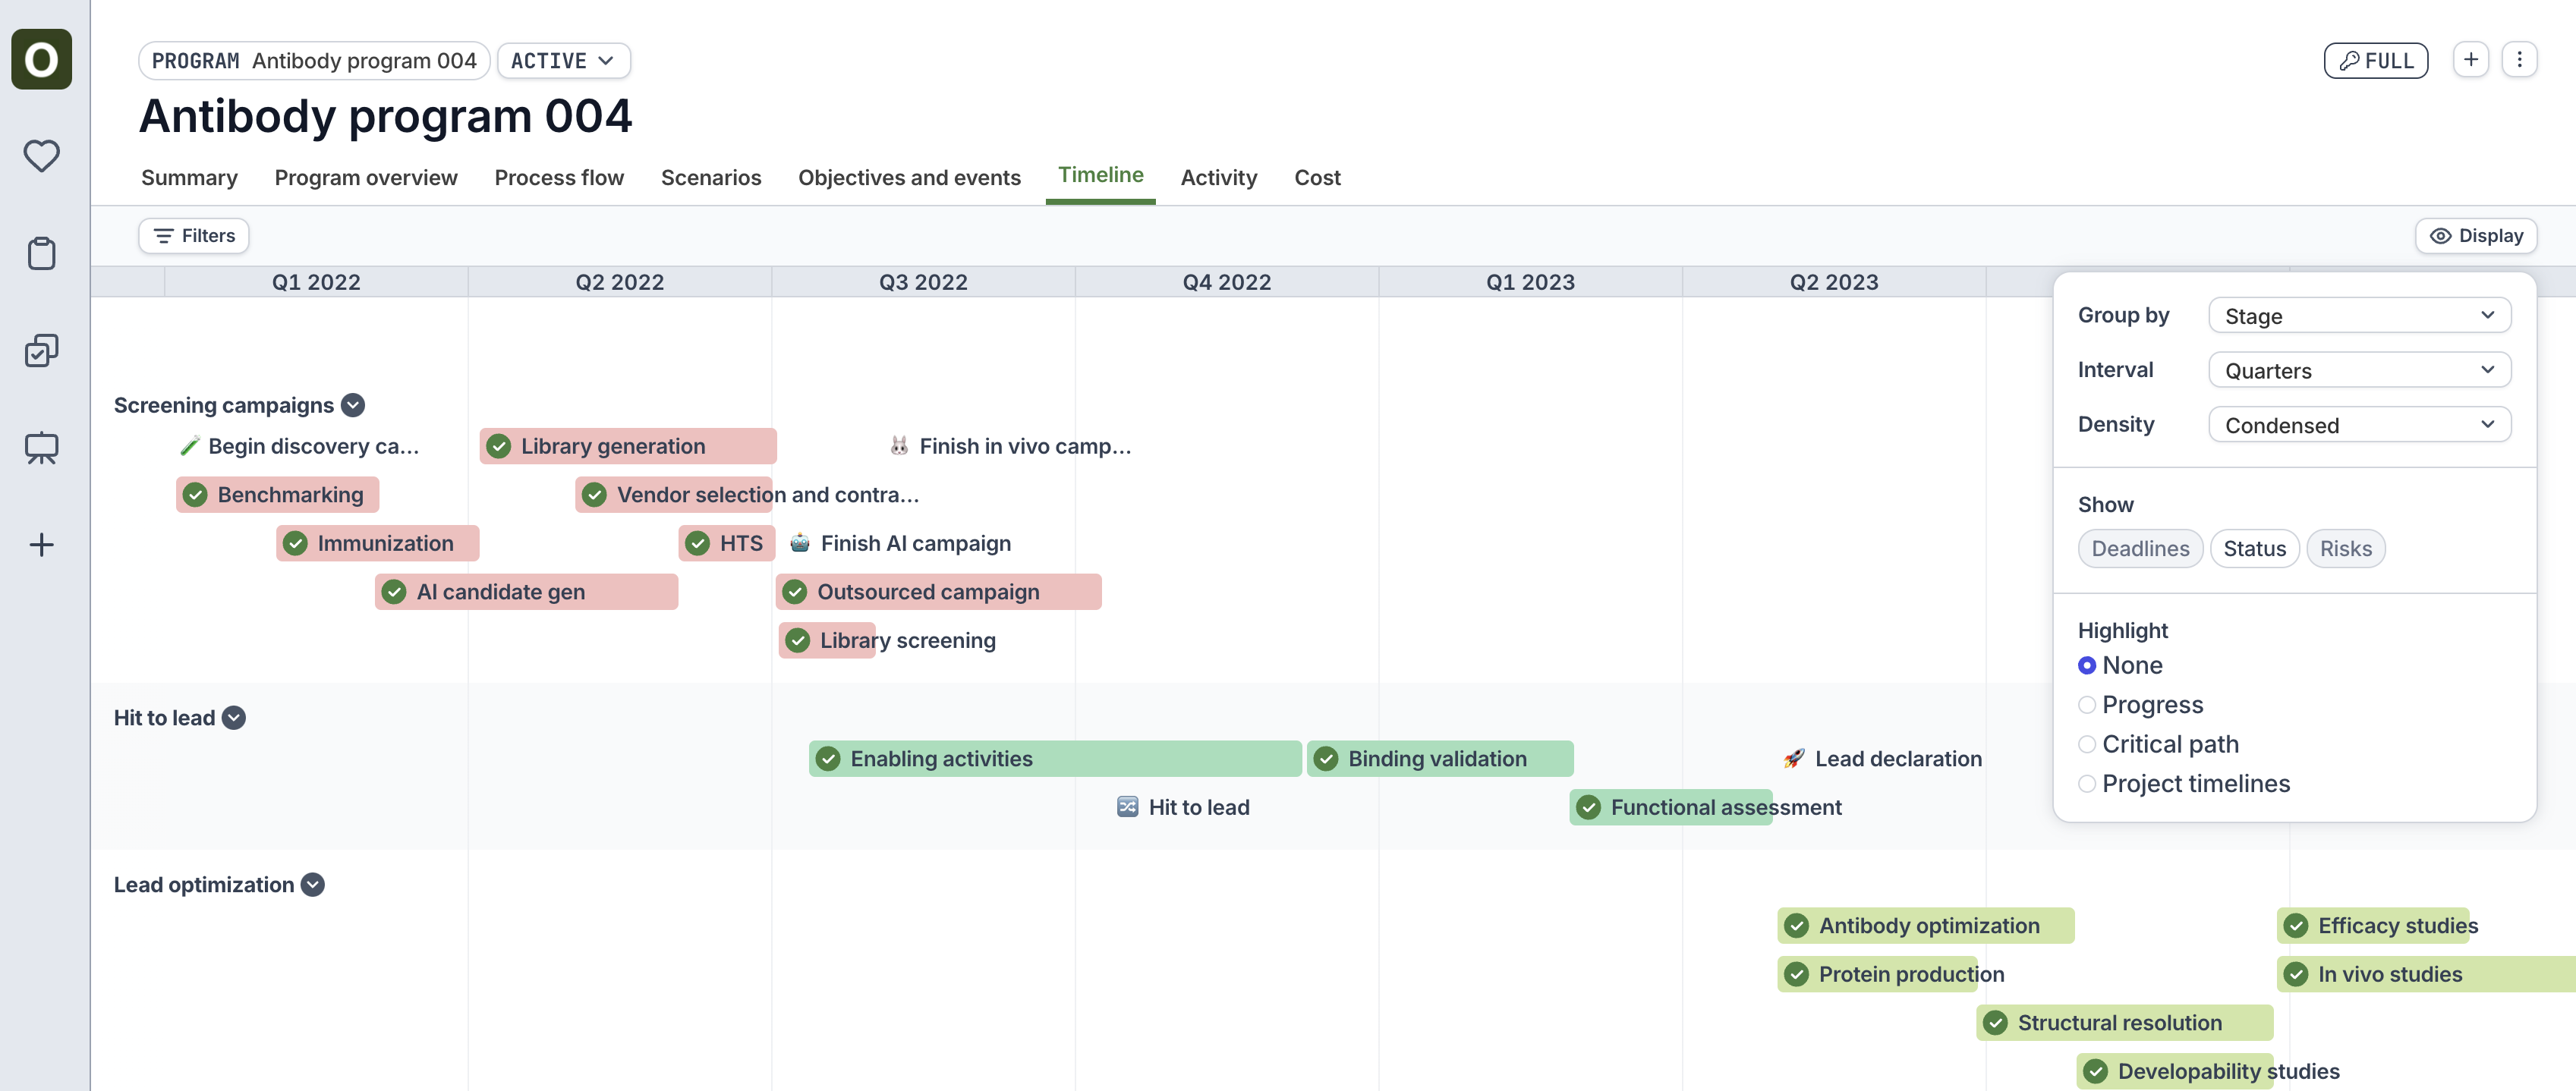 The **Highlight** mode within the Display menu also provides additional visualization customizations:
* **Progress**: Shows the completion % of the project tasks within an Objective
* See [Linking projects to program plans](/programs/link-project)
* **Critical path**: Highlights the critical path in red (i.e., path of longest duration)
* **Project timelines**: Displays the project timelines for a project within an Objective
* Green projects indicate the the project dates are within the planned objective dates
* Orange projects indicate that the project is overrunning the planned dates.
The **Highlight** mode within the Display menu also provides additional visualization customizations:
* **Progress**: Shows the completion % of the project tasks within an Objective
* See [Linking projects to program plans](/programs/link-project)
* **Critical path**: Highlights the critical path in red (i.e., path of longest duration)
* **Project timelines**: Displays the project timelines for a project within an Objective
* Green projects indicate the the project dates are within the planned objective dates
* Orange projects indicate that the project is overrunning the planned dates.